Welcome to TERN Knowledge Base
Species-Level data: 'species_table' function
The 'species'_table function in the 'ausplotsR' is used to generate a species occurrence matrix from AusPlots raw data. The species occurence matrix can be then used in multiple applications that require species-level data. For example, it can be used to investigate patterns of presence/absence and/or abundance (note that vegetation 'cover' is used as a surrogate for vegetation 'abundace'), compute indices of species diversity, or elaborate rank-abundance plots.
The 'species_table' function takes a data frame of individual raw point intercept hits (i.e. a veg.PI data frame) generated using the 'get_ausplots function', and returns a ‘species against sites’ matrix. Four metrics can be selected to score species occurrence:
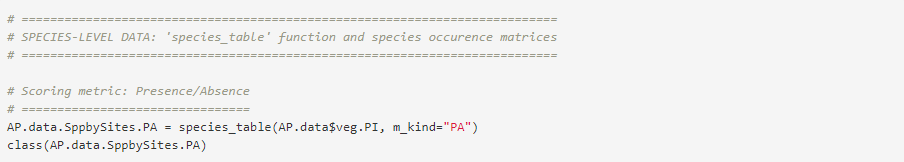
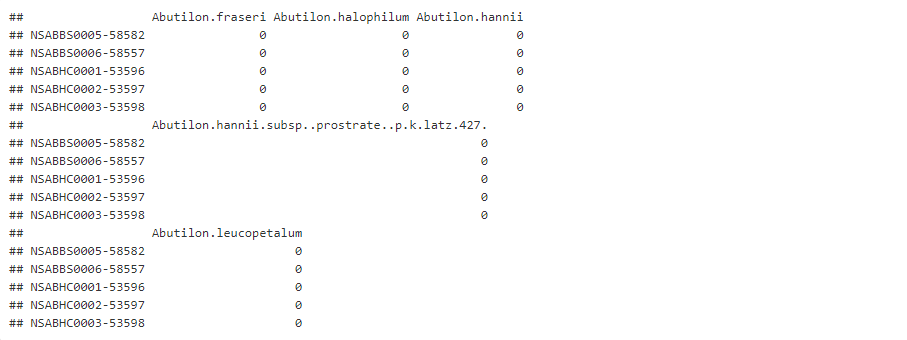
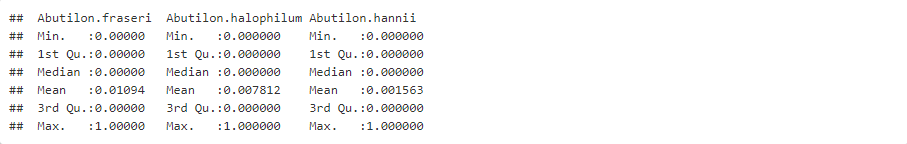
- Presence/Absence: Set by the argument 'm_kind = "PA"'.
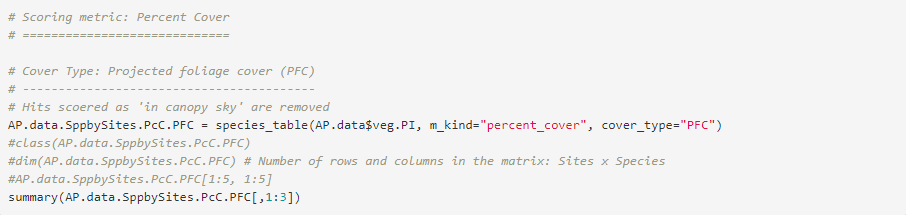
- Percent Cover: Based on total frequency of hits. This is the most commonly used metric. Set by the argument 'm_kind = "percent_cover"'.
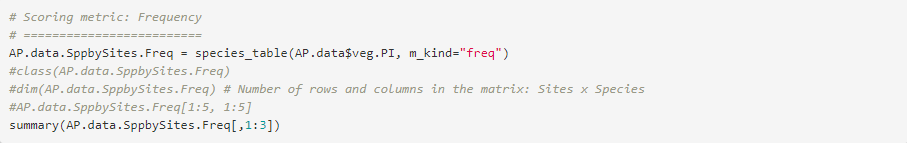
- Frequency: Based on proportional frequencies of presence on the 10 individual transects within a plot. Set by the argument 'm_kind = "freq"'. It can be a measure of importance for low cover species.
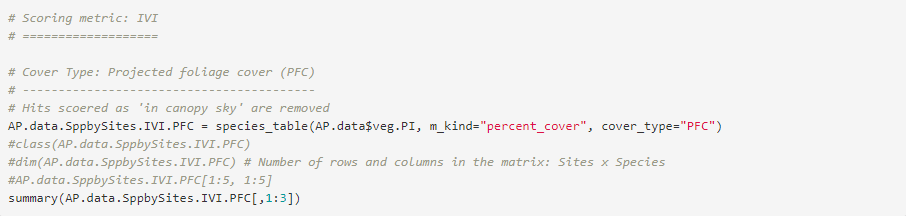
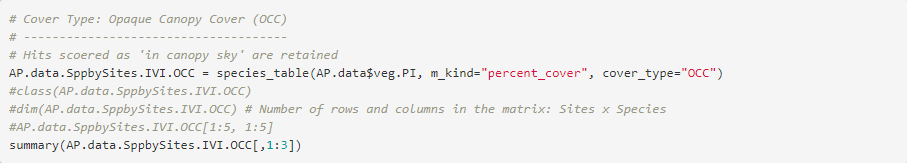
- IVI: A combination of cover and frequency. Set by the argument 'm_kind = "IVI"'.
If Percent Cover or IVI are used two types of cover type can be selected:
- Projected Foliage Cover (PFC):Hits scored as ‘in canopy sky’ are removed. Set by the argument 'cover_type = "PFC"'.
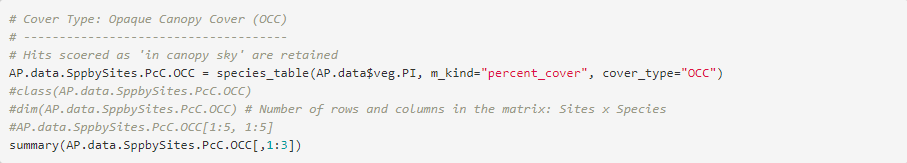
- Opaque Canopy Cover (OCC): Hits scored as ‘in canopy sky’ are retained. Set by the argument 'cover_type = "OCC"'
EXAMPLES
Examples of the different arguments combinations in the 'species_table' function are presented below. Species occurrence matrices are computed for the full set of vegetation point intersect data currently available at AusPlots. The list of data frames containing information for all currently available AusPlots sites (i.e. the 'AP.data' list) was previously created using the `get_ausplots` function (see the 'Obtaining AusPlots data: 'get_ausplots' function' Step-by-Step Guide; we use the list created in Example 4). The class and dimensions of the returned data frame are the same in all examples, so they are only displayed for the first example (the corresponding code is commented out in the other examples). The resulting species occurrence data frames can be enriched with additional information (see the 'Manipulating AusPlots data II: Merging data frames' Step-by-Step Guide).
Example 1. Scoring metric; Presence/Absence ('m_kind = "PA")


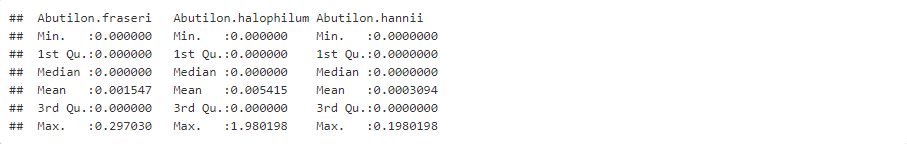
Example 2A. Scoring metric; Percent Cover (m_kind = "percent_cover"), Cover Type: Prejected Foliage Cover (cover_type="PFC")
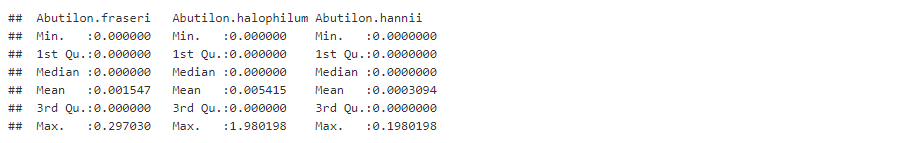
Example 2B. Scoring metric; Percent Cover (m_kind = "percent_cover"), Cover Type: Opaque Canopy Cover (cover_type="OCC")
Example 3. Scoring metric; Frequency ('m_kind = "freq")
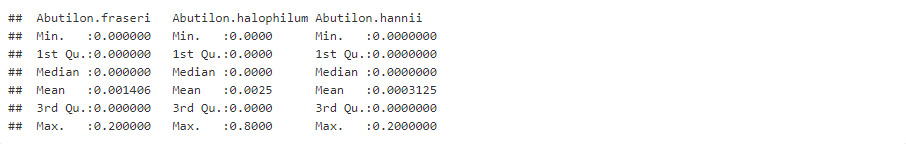
Example 4A. Scoring metric; IVI (m_kind = "IVI"), Cover Type: Prejected Foliage Cover (cover_type="PFC")

Example 4B. Scoring metric; IVI (m_kind = "IVI"), Cover Type: Opaque Canopy Cover (cover_type="OCC")

Provide your feedback about the experience with Knowledge base