Welcome to TERN Knowledge Base
Obtaining AusPlots data: 'get_ausplots' function
The 'get_ausplots' function extracts and compiles AusPlots data.
Data of specific types, sites, geographical locations, and/or species can be requested via the function arguments.
DATA TYPES: Up to 8 different types of data can be obtained by setting the corresponding arguments to TRUE/FALSE. Each type of data will be retrieved and compiled into a distinct dataset contained in a separate data frame. 'get_ausplots' returns a list, which elements are the data frames for the requested types of data. The 8 types of data include:
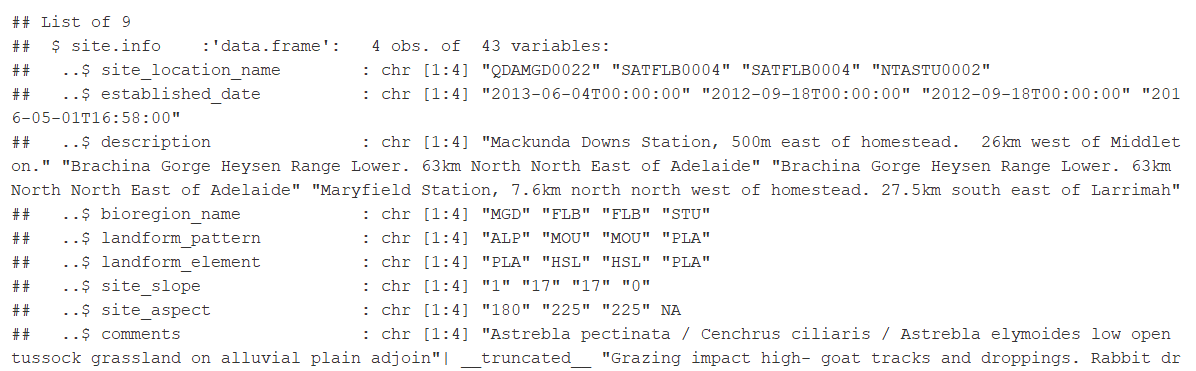
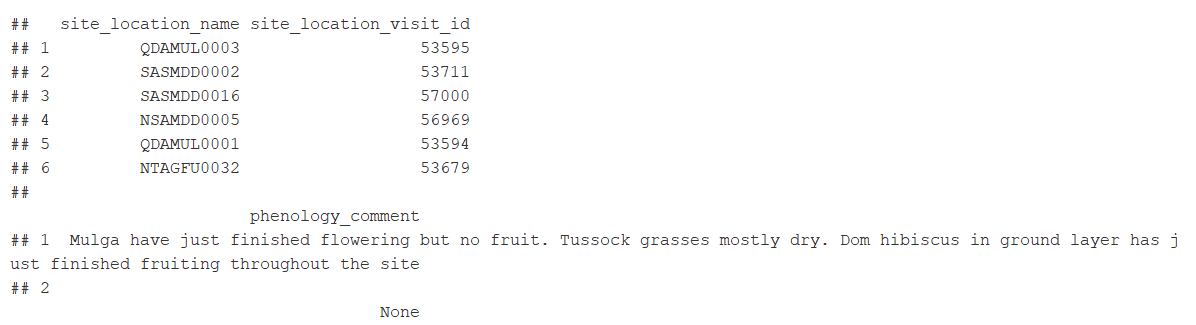
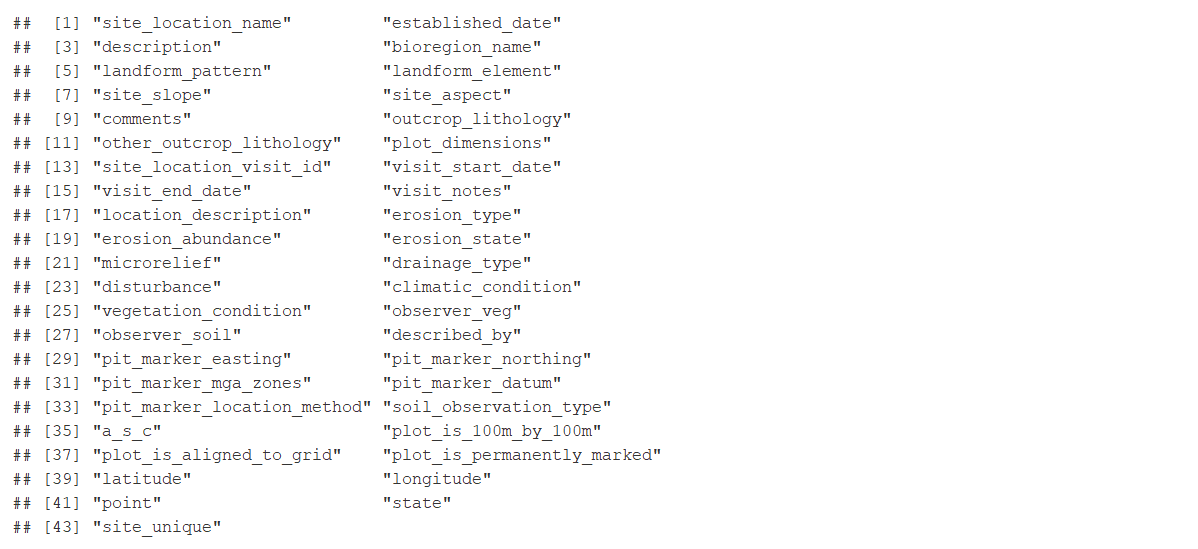
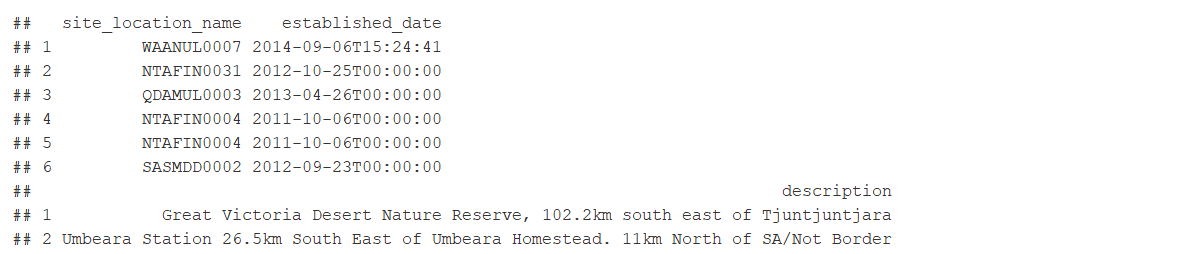
* 'site_info': Site summary data. Includes (among others): plot and visit details, landform data, geographic coordinates, and notes. Included by default. Site summary data are stored in the 'site.info' data frame.
* 'structural_summaries': Site vegetation structural summaries. Site vegetation structural summary data are stored in the 'struct.summ' data frame.
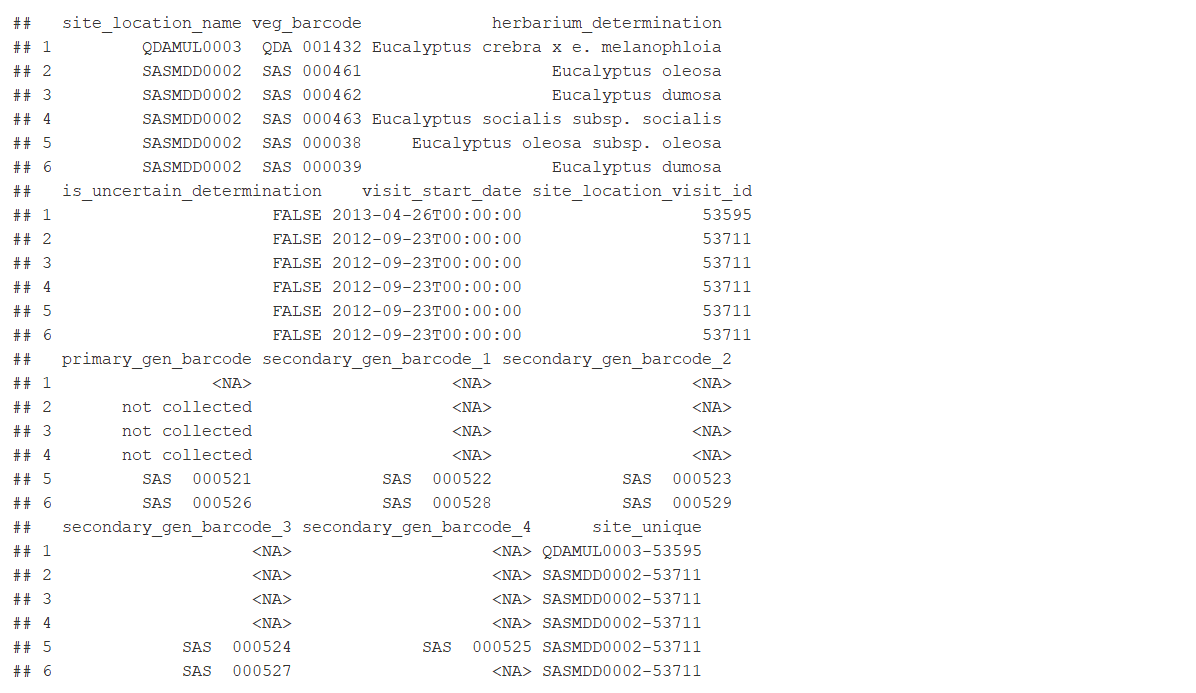
* 'veg.vouchers': Complete set of species records for the plot determined by a herbarium plus ID numbers for silica-dried tissue samples. Included by default. Vegetation vouchers data are stored in the 'veg.vouch' data frame.
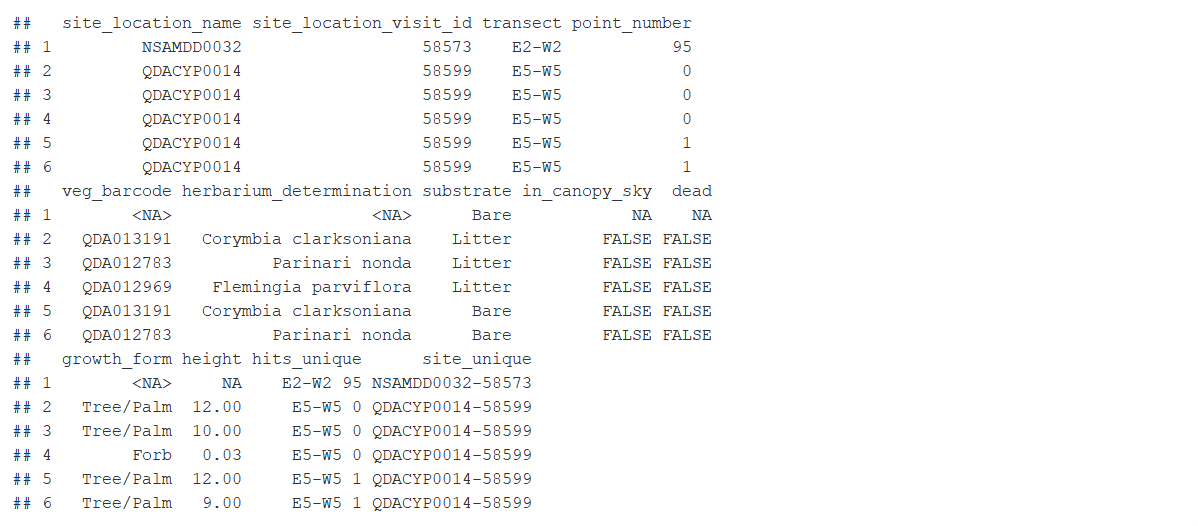
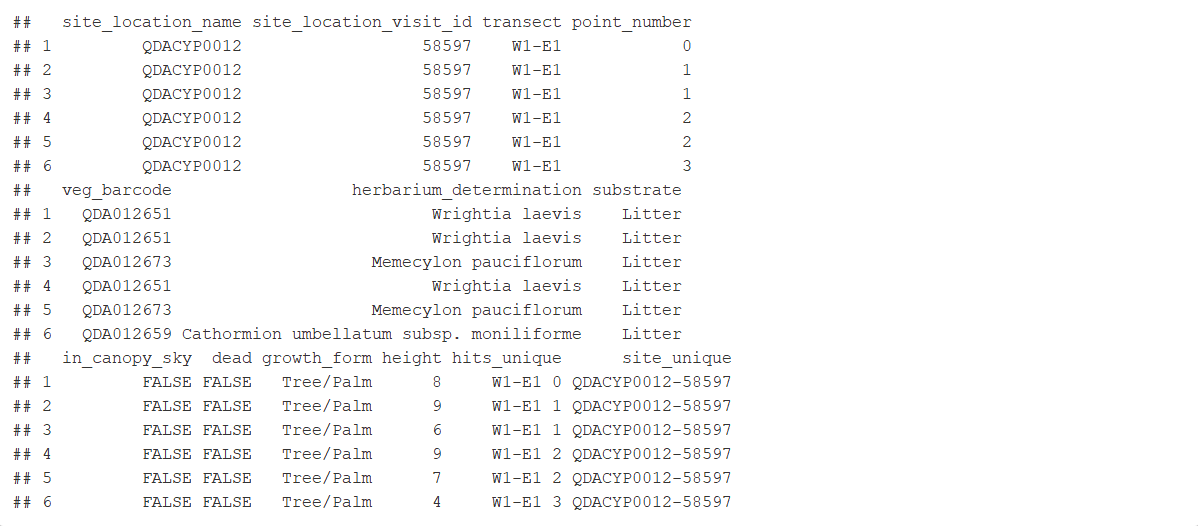
* 'veg.PI': Point Intercept (PI) data. Includes data on: substrate, plant species, growth form and height, etc at each of (typically) 1010 points per plot. Included by default. Vegetation point intercept data are stored in the 'veg.PI' data frame.
* 'basal.wedge': Basal Wedge Data Raw Hits. These data are required for the calculation of Basal Area by Species by Plot. Basal wedge data are stored in the 'veg.basal' data frame.
* 'soil_subsites': Information on what soil and soil metagenomics samples were taken at nine locations across the plot and their identification barcode numbers. Soil and soil metagenomics data are stored in the 'soil.subsites' data frame.
* 'soil_bulk_density': Soil bulk density. Soil bulk density data are stored in the 'soil.bulk' data frame.
* 'soil_character': Soil characterisation and sample ID data at 10 cm increments to a depth of 1 m. Soil characterisation and sample ID data are stored in the 'soil.char' data frame.
SPATIAL (PLOT & BOUNDING BOX) FILTERING: AusPlot data can be spatially subset via the 'get_ausplots' function arguments in two ways:
* 'my.Plot_IDs': Character vector with the plots IDs of specific AusPlots plots.
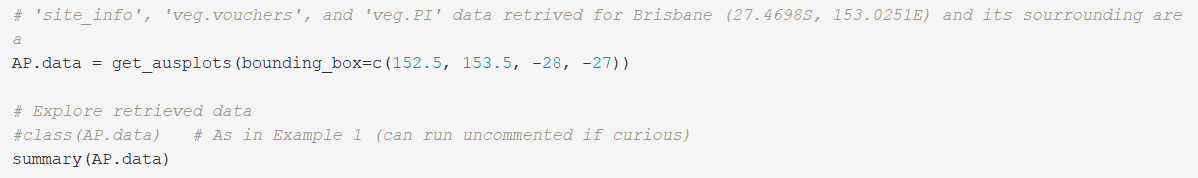
* 'bounding_box': Spatial filter for selecting AusPlots based on a rectangular box, in the format of e.g. c(xmin, xmax, ymin, ymax). AusPlots spatial data are are in longlat, thus x is the longitude and y is the latitude of the box/extent object (e.g., c(120, 140, -30, -10)).
SPECIES FILTERING: AusPlots data can also be subset by particular or sets of genus and/or species (i.e. as determined for the herbarium voucher) using the argument 'species_name_search'. This optional argument takes the form of a character string indicating the terms to search and subset. Search terms are not case sensitive and do not require an exact taxonomic match (e.g. "Eucalyptus moderata","Eucalyptus", and "euca" are all acceptable search terms).
Species Filtering behaviour slightly differs among Data Types (i.e. for the different types of created Data Frames):
* For 'veg.vouch' and 'basal.wedge', when these arguments are set to 'TRUE', 'get_ausplots' returns data.frames with the corresponding data (i.e. voucher records and raw basal wedge data respectively) that match the species_name_search.
* For the remaing data types arguments, when these arguments are set to 'TRUE', 'get_ausplots' returns data.frames with the corresponding data (e.g. point intercept data,...) for all plots where the species_name_search occurs.
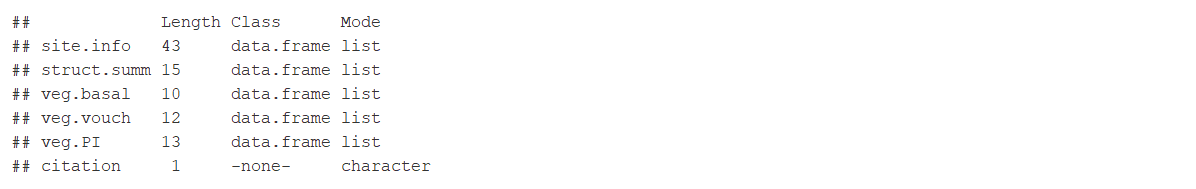
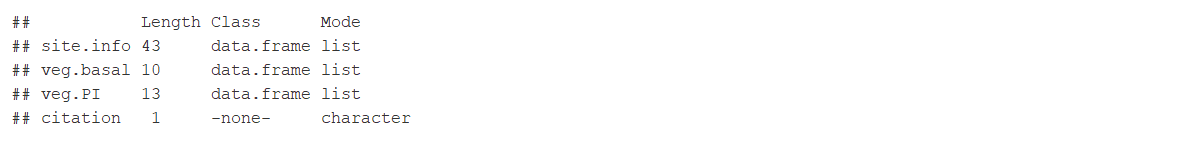
The R object resulting from calling 'get_ausplots' is a list of data frames containing the requested AusPlots data. The list includes a data frame for each type of data requested (i.e. up to 8 data frames: 'site_info', 'structural_summaries',...) and an auto-generated citation for the data extracted. Please cite ausplotsR and the TERN AusPlots data you use. In each data frame the columns correspond to the variables supplied for each type of data and the number of rows (directly or indirectly) depends on the sites (i.e. via 'my.Plot_IDs' or 'bounding_box' if subsetted) or species (i.e. via 'species_name_search' if subset) retrieved.
There are several variables common to all data frames. These include 'site_location_name', 'site_location_visit_id', and 'site_unique' (a combination of the previous two). These variables can be used to merge data frames. For example, the contents of two data frames can be combined using the common variable as a link (i.e. guidance to add the merged contents in the correct row). The variable 'site_unique' is typically the best option to link data frames in a merge, as it is the most specific variable representing a single visit to a particular site and it should be used in most analyses. Otherwise, errors such including data from the wrong visit to a site can occur.
EXAMPLES
To run the examples below the 'ausplosR' library should have been installed and loaded in R, as show in 'Installing and Loading 'ausplotsR'' the Step-by-Step Guide.
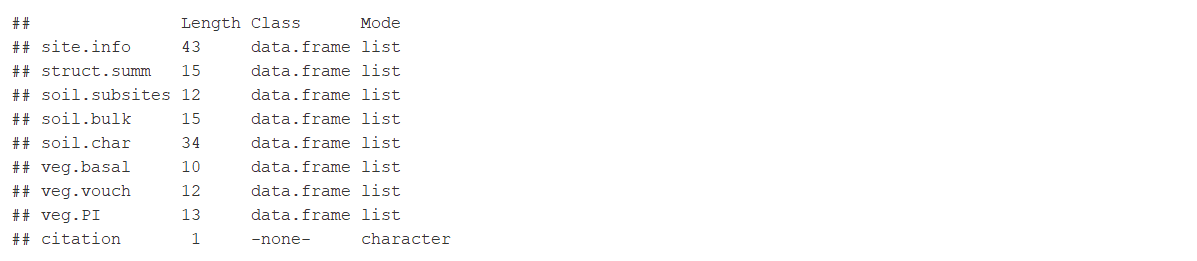
Example 1: All available data (i.e. all data types) for 3 plots


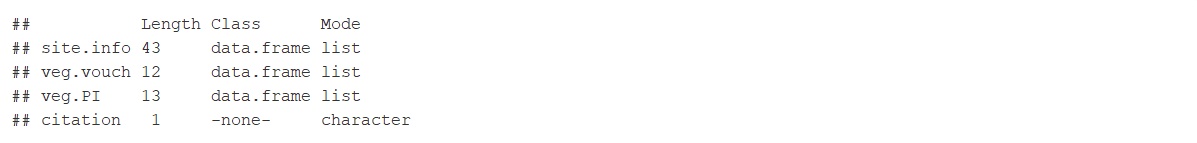
Example 2: Default data for a particular Geographic Extent
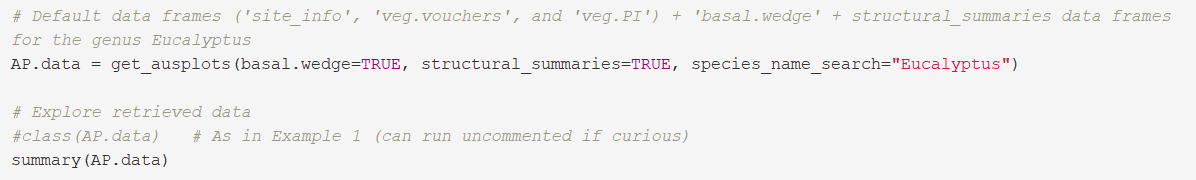
Example 3: 'Default data' + 'basal.wedge' + 'structural_summaries' for the genus Eucalyptus


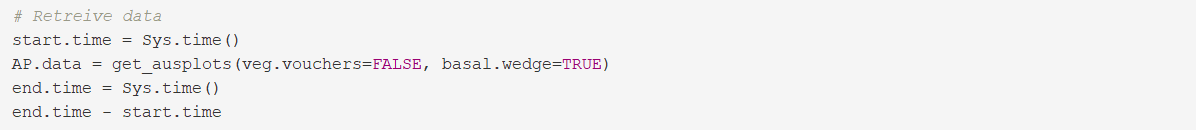
Example 4: 'site_info', 'veg.PI', and 'basal.wedge' data for all sites


Provide your feedback about the experience with Knowledge base