Welcome to TERN Knowledge Base
Plant Growth Form data: 'growth_form_table' function
The 'growth_form_table' function in the 'ausplotR' package can be used to generate occurrence matrices for plant growth forms in the AusPlots plots. The plant growth forms considered are those in the National Vegetation Information System (NVIS; Executive Steering Committee for Australian Vegetation Information, 2003).
The input for the 'growth_form_table' function is a data frame of raw AusPlots point intercept data generated using the 'get_ausplots function'. Three metrics can be selected to score species growth form:
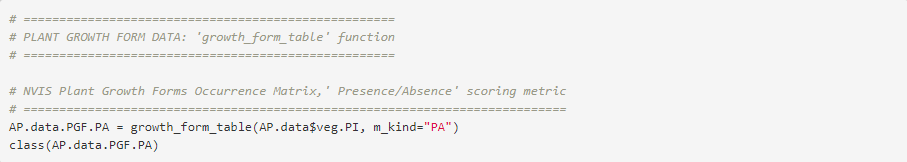
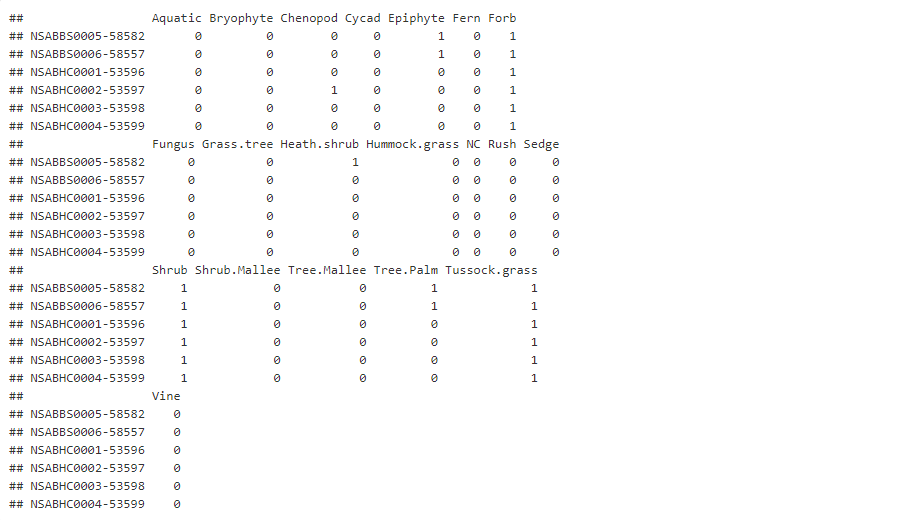
- Presence/Absence: Set by the argument 'm_kind = “PA”'.
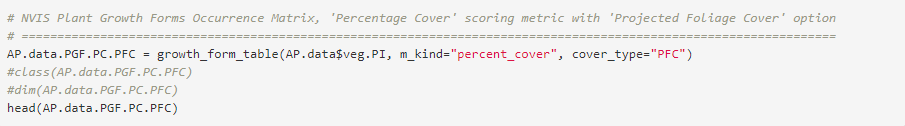
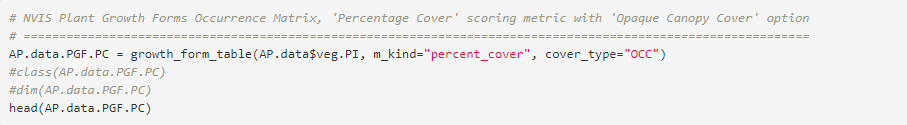
- Percent Cover: Based on total frequency of hits. Set by the argument 'm_kind = “percent_cover”'. This is the most useful and commonly used metric. It can be subsequently used in statistical analyses (e.g. MANOVA, Ordination, Classification, etc.) at continental scale where species turnover is too high for some methods to provide meaningful results.
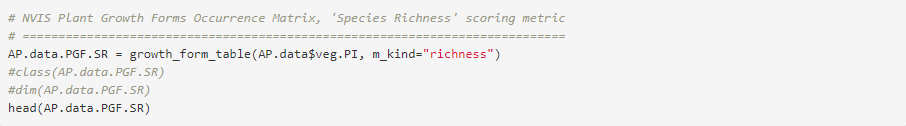
- Species Richness: Set by the argument 'm_kind = “richness”'. Note that when ‘m_kind’ is set to “richness” the rowSums of the occurrence matrix can be higher than the observed SR because in some occasions the same species is recorded with different growth forms in a plot and therefore the same species can count towards the weights for multiple growth forms.
Whe Percent Cover is used two types of cover type can be selected:
- Projected Foliage Cover (PFC): Hits scored as ‘in canopy sky’ are removed. Set by the argument 'cover_type = "PFC"'.
- Opaque Canopy Cover (OCC): Hits scored as ‘in canopy sky’ are retained. Set by the argument 'cover_type = "OCC"'.
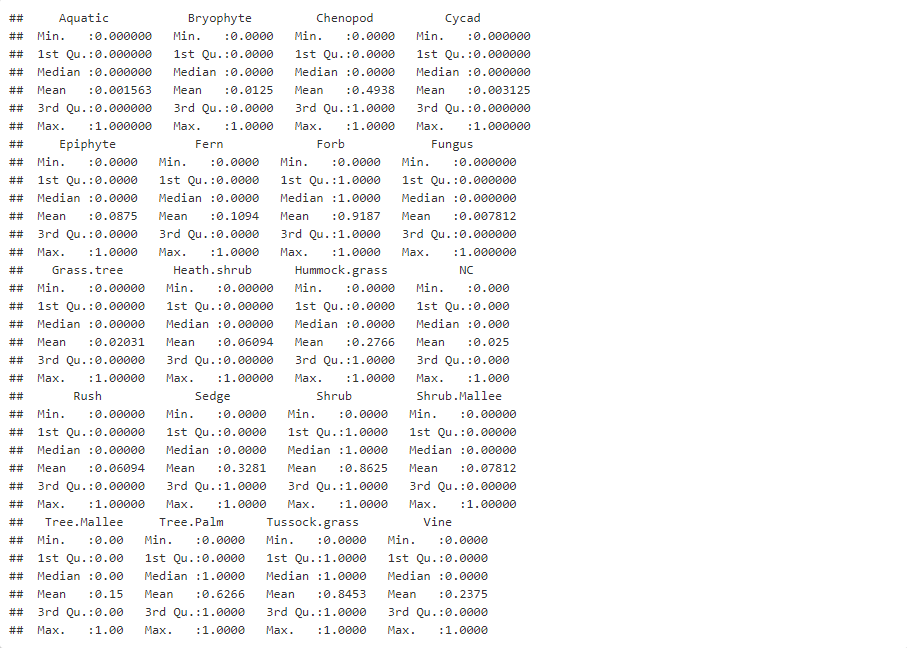
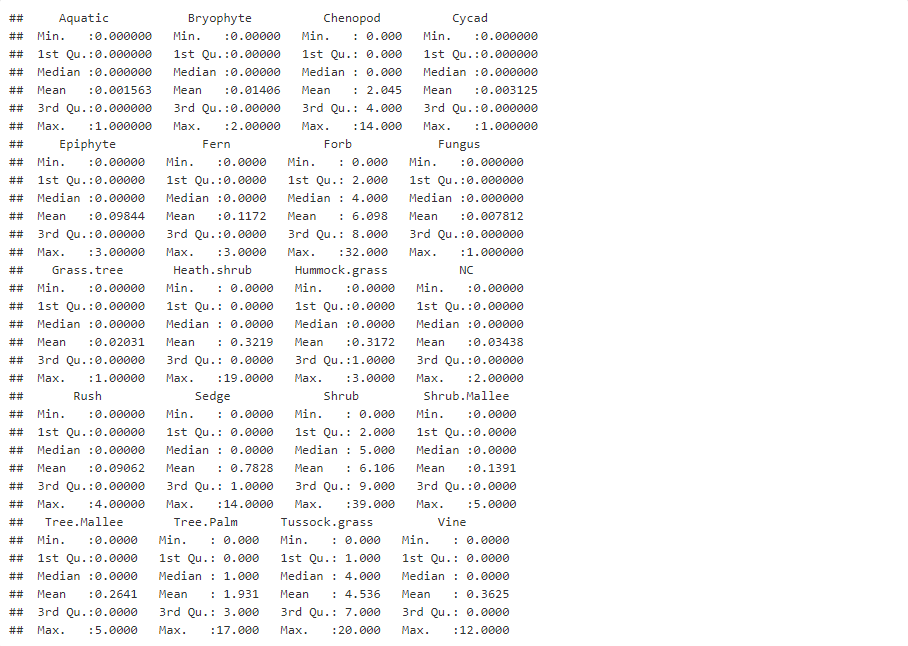
The output of the 'growth_form_table' function is a data frame. In this output data frame rows correspond to unique sites, columns to NVIS plant growth forms, and cell values are either Presence/Absences, Percent Cover, or Species Richness depending on the option chosen for the ‘m_kind’ argument.
REFERENCES
- National Vegetation Information System, Version 6.0
Executive Steering Committee for Australian Vegetation Information (ESCAVI)
Department of the Environment and Heritage, 2003
ISBN 0 642 54953 2
EXAMPLES
Examples of the use of the 'growth_form_table' funtion are presented below. In the examples growth form ocurrences are computed using different scoring metrics (i.e. Presence/Absence, Percentage Cover, and Species Richness) by varying the argument values (see above). Growth form types occurrences are computed for the full set of vegetation point intersect data currently available at AusPlots. The list of data frames containing information for all currently available AusPlots sites (i.e. the 'AP.data' list) was previously created using the `get_ausplots` function(see the 'Obtaining AusPlots data: 'get_ausplots' function' Step-by-Step Guide; we use the list created in Example 4). The resulting 'Fractional Cover' data frames can be eriched with addional information as seen in the 'Manipulating AusPlots data II: Merging data frames' Step-by-Step Guide.
Example 1: NVIS Plant Growth Forms Occurrence Matrix,' Presence/Absence' scoring metric.


Example 2A: NVIS Plant Growth Forms Occurrence Matrix, 'Percentage Cover' scoring metric with 'Projected Foliage Cover' (PFC) option.
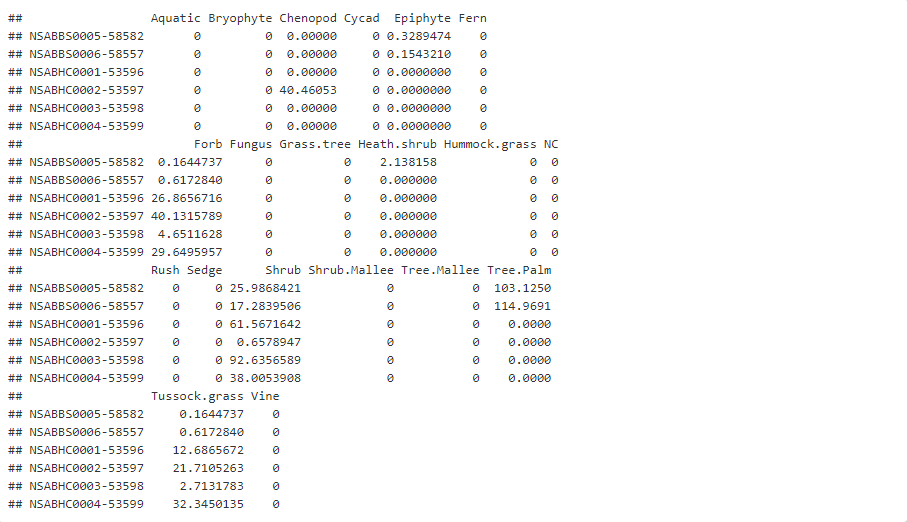

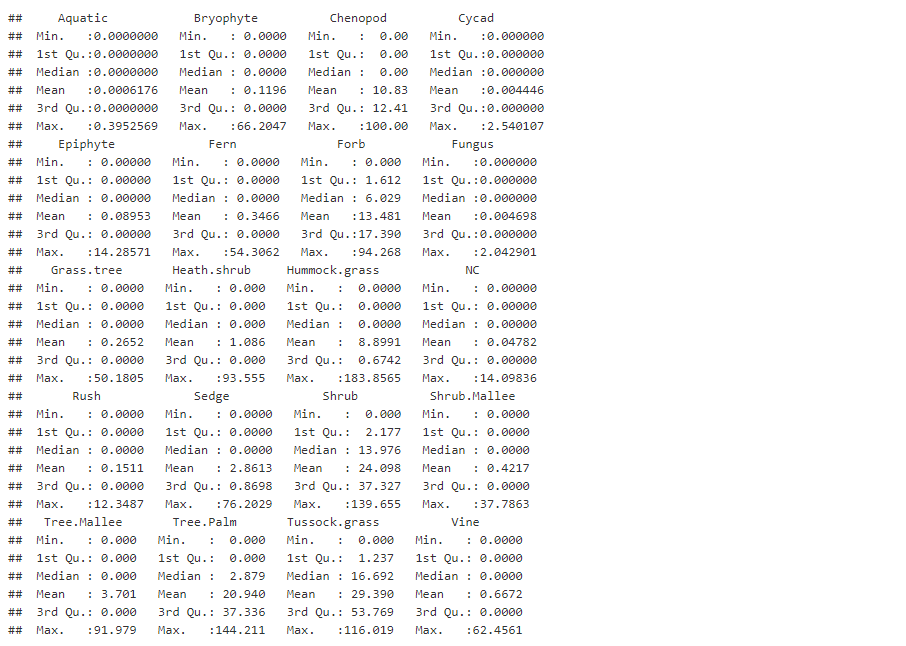
Example 2B: NVIS Plant Growth Forms Occurrence Matrix, 'Percentage Cover' scoring metric with 'Opaque Canopy Cover' (OCC) option.


Example 3: NVIS Plant Growth Forms Occurrence Matrix, 'Species Richness' scoring metric.

Provide your feedback about the experience with Knowledge base