Welcome to TERN Knowledge Base
Basal Area data: 'basal_area' function
The 'basal_area' function in the 'ausplotsR' package calculates the Basal Area or Mean Number of Basal Wedge Hits of plots using the raw basal wedge data returned by the 'get_ausplots' function also in the 'ausplotsR' package.
The basal_area function has the following arguments:
- 'veg.basal': Name of the data frame containing the Raw Basal Wedge Data generated by the 'get_ausplots' function in the 'ausplotsR' package.
- 'by.spp': Whether Basal Wedge values are computed by Plot or Individual Species. This argument can take two values:
- 'FALSE': The function returns combined values per plot. This is the default value for the argument.
- 'TRUE': Returns values for individual species
- 'by.hits': Whether the Basal Wedge values are computed as Basal Area or Mean Number of Individual Basal Wedge Hits. This argument can take two values:
- 'FALSE': The function returns the Basal Area (in m2/ha). This is the default value for the argument.
- 'TRUE': Returns the Mean Number of Individual Basal Wedge Hits.
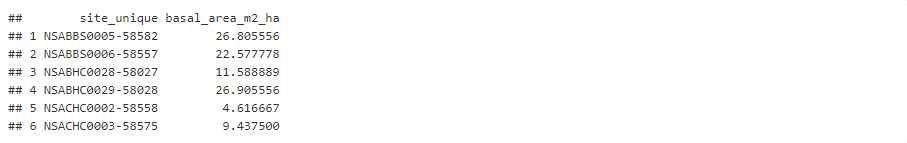
This function returns a data frame with two columns. In this data frame rows correspond to representing Plots (or species by plots), the first column contains the unique sites names and the second column contains the Basal Area or Hit Scores depending on the value assigned to the 'by.hits' argument.
EXAMPLES
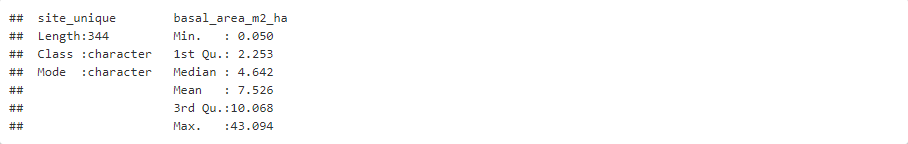
Examples of the use of the 'basal_area' function to compute the Basal Area or Mean Number of Basal Wedge Hits of individual plots from raw basal wedge data (as returned by the 'get_ausplots' function) are presented below. Basal areas (or mean number of /wedge hits) are computed for the full set of basal wedge data currently available at AusPlots. The list of data frames containing information for all currently available AusPlots sites (i.e. the 'AP.data' list) was previously created using the 'get_ausplots' function (see the 'Obtaining AusPlots data: 'get_ausplots' function' Step-by-Step Guide; we use the list created in Example 4). The resulting Basal Areas or Mean Number of Wedge Hits data frames can be enriched with additional information as seen as seen in the 'Manipulating AusPlots data II: Merging data frames' Step-by-Step Guide. The examples below cover all possible combinations of argument values in the 'basal_area 'function.
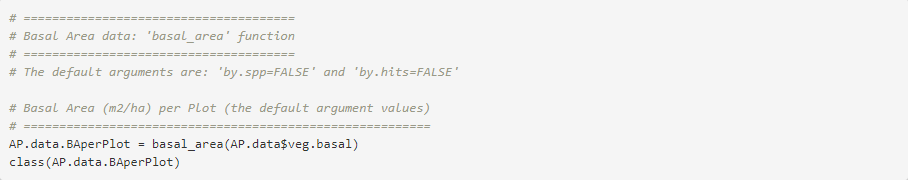
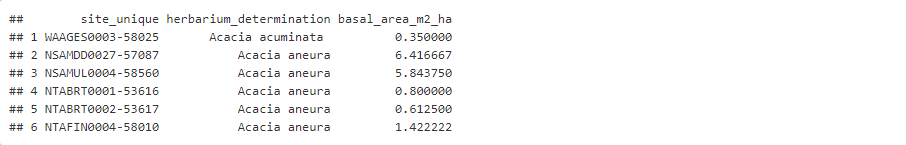
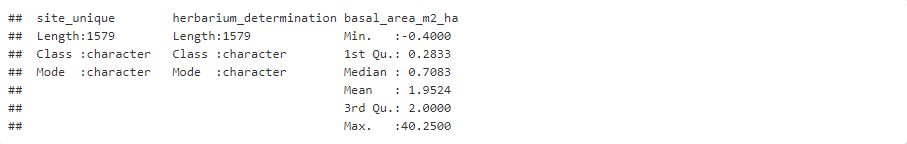
Example 1: Basal Area (m2/ha) per Plot (the default argument values)


.
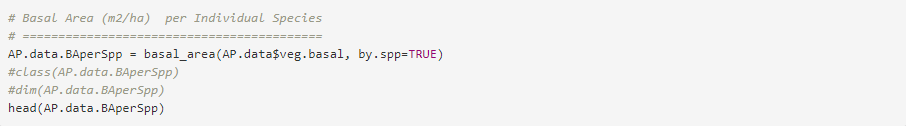
Example 2: Basal Area (m2/ha) per Individual Species

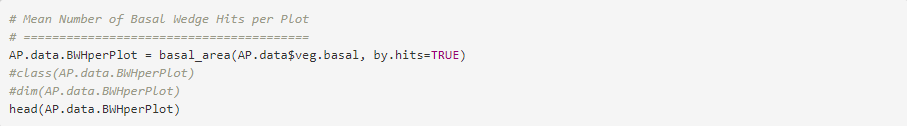
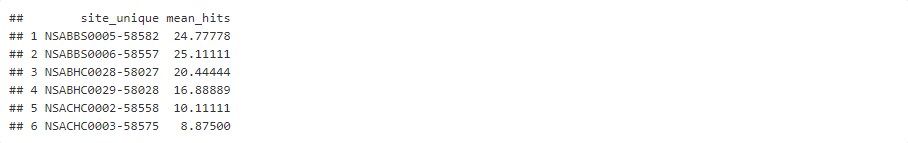
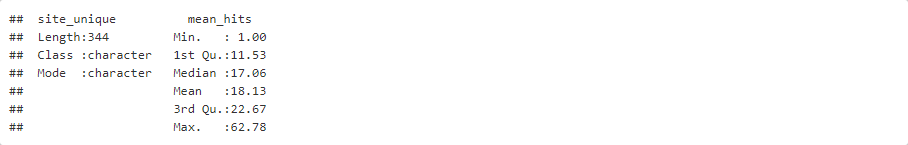
Example 3: Mean Number of Basal Wedge Hits per Plot

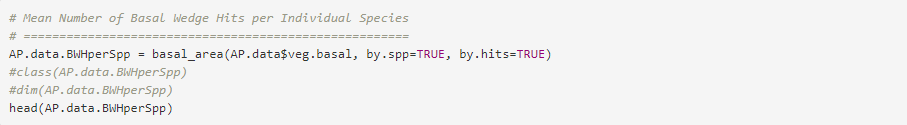
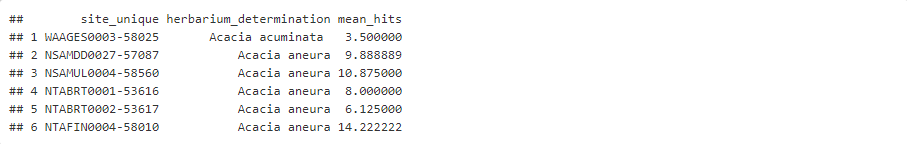
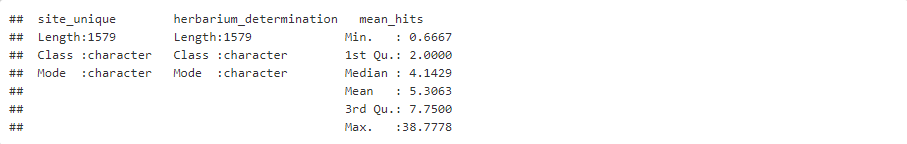
Example 4: Mean Number of Basal Wedge Hits per Individual Species

Provide your feedback about the experience with Knowledge base