Ecosystem Surveillance Monitoring - AusPlots Methods
To enable consistent ecological monitoring and assessment across plots, standardised data collection methods were specifically developed for TERN's Ecosystem Surveillance Monitoring program. Collectively these set of data collection methods are referred to as the 'AusPlots' methods. AusPlots methods were developed in collaboration with all ecosystem jurisdictions. Field data collection is aided by an Android app developed by the AusPlots team.
The AusPlots methods are described in the next sections. Further detais about the AusPlots Methods can be found in the AusPlots Rangelands Survey Protocols Manual.
Naming Conventions
Names are assigned to each plot to simultaneously identify them and describe their locations. Plot names have the following structure:
2 Letters for State, 1 Letter for Plot Type – 3 Letters for Bioregion – 4 Numbers for Plot ID
The letters for State, Plot Type and Bioregion codes are:
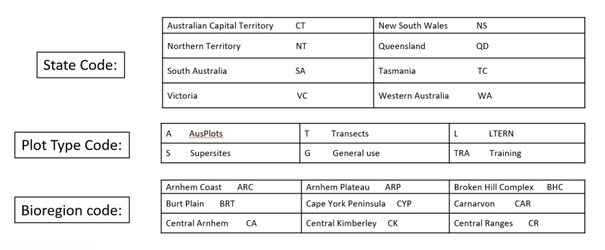
For example, the plot name 'SAS-MDD-0001' corresponds to the South Australia Supersites – Murray Darling Depression – Plot #1.
Plot Layout
The size of all plots is 100m x 100m (= 1 ha.). Each plot contains 10 transects, 5 oriented North to South and 5 oriented East to West. Within each plot there are 9 sampling locations, situated at the intersections of the outermost and central transects (Figure 1).
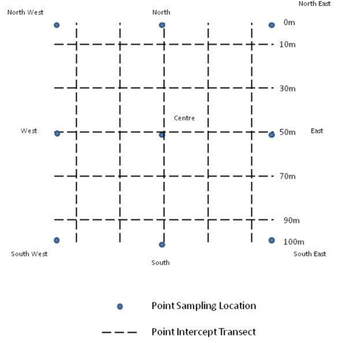
Figure 1. TERN's Ecosystem Surveillance Monitoring plots layout.
Measurements & Sampling
The following measurements and samples are collected at the plots:
- Plot: Plot Description (following the “Yellow Book” for physiography; "Yellow Book" is the popular nickaname for the "Australian Soil and Land Survey Field Handbook", see references below).
- SW Corner:
- Soil Characterization (500g samples at 10cm increments to 1m)
- Site Photograph
- Central Peg: Photo panorama (3600) at 3 points
- 9 Point Sampling Locations:
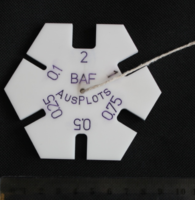
- Basal Area at 1.3 using basal wedge
- Soil Cores at 3 depths (0-10, 10-20, 20-30cm)
- Soil Bulk Density at 0-10, 10-20, 20-30cm from pit
- Soil Metagenomics (200g)
- 50 Points in Quadrat (if canopy height > 2m): Leaf Area Index
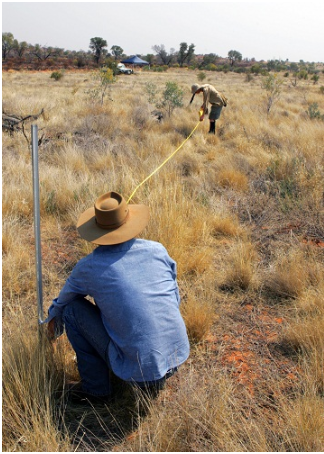
- 1010 Points (i.e. 101 Points (points at 1m intervals in 100m transects) x 10 Transects (5 North to South and 5 East to West)):
Plant species
Cover/Growth form
Height
Stratum at he vertical projection (above & below; laser pointer, densitometer to view canopy)
For each species of vascular plant (samples barcoded and scanned with app):
Voucher Samples
Genetic and Isotope Samples: Sub-sample form vouchers

REFERENCES
- Australian Soil and Land Survey Field Handbook, 3rd edition. CSIRO Publishing, Melbourne.